Systematic effects of photometric redshifts
on the Void Size Function
Using the enormous photometric catalogues of the Vera C. Rubin Observatory to turn cosmic voids into a competitive probe of dark energy — once we understand how fuzzy distances distort their statistics.
Cosmic voids and the Void Size Function
The Universe is not a uniform soup of galaxies. Matter is woven into an intricate web of filaments, sheets and clusters — and the largest pieces of that mosaic are the cosmic voids: vast, underdense bubbles that fill most of the volume of the observable Universe.
A typical cosmic void spans tens of mega-parsecs across and contains only a handful of galaxies. Because they are nearly empty, voids are the cleanest cosmological laboratories we have: their interior dynamics are dominated by dark energy rather than non-linear gravity, and the imprint of modified-gravity theories on their growth is amplified rather than washed out.
Theoretically, the VSF was derived from the same excursion-set machinery as the halo mass function (Sheth & van de Weygaert 2004; Jennings et al. 2013): it predicts a peaked distribution where small voids merge into bigger ones as structure grows, leaving a characteristic falloff at large radii whose position is set by the linear growth of structure — and therefore by cosmology. To exploit the VSF observationally we need accurate galaxy positions and a faithful void-finding algorithm. Both pieces are challenged when galaxy distances come from photometric, not spectroscopic, surveys — which is exactly where Rubin/LSST will live.
Each new void detected on the cosmic web traces a line to its bin in the Void Size Function. After 18 voids the histogram approximates the dashed theoretical curve underneath — that's the basic VSF measurement that Project A and Project B make rigorous on full LSST mocks.
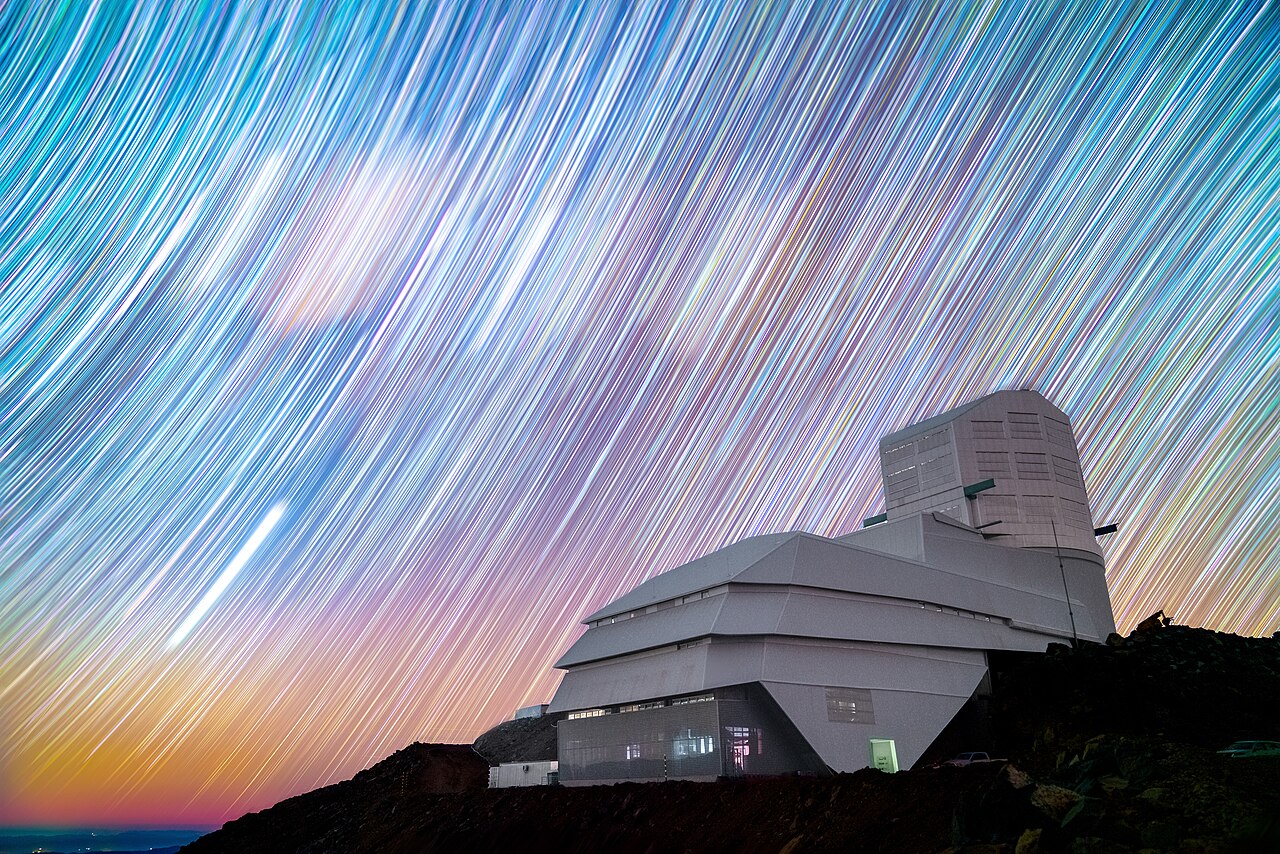
The Vera C. Rubin Observatory & LSST
Perched at 2 680 m on Cerro Pachón in the Chilean Andes, the NSF–DOE Vera C. Rubin Observatory is about to carry out the most ambitious optical sky survey ever attempted: a ten-year, six-band scan of half the sky called the Legacy Survey of Space and Time (LSST).
Rubin combines an 8.4-m primary mirror with the largest digital camera ever built (3.2 gigapixels). Every clear night it images the southern sky in two filters, returning to the same patch every few days. After a decade, LSST will have catalogued ~20 billion galaxies and as many stars in six bands (u, g, r, i, z, y).
- ~37 billion stars and galaxies across 18 000 deg² of sky.
- 6 bands · 10 years · ~3 000 images per night.
- Dark Energy Science Collaboration (DESC) — the gateway through which I contribute.
Rubin's depth means that voids will be detected out to redshifts where the universe was less than half its current age, when dark energy was just beginning to dominate. The statistical power is staggering: tens of thousands of voids, an order of magnitude beyond anything we have today. But statistical power is wasted if we cannot control systematics. Photometric distance errors leak directly into the radii and positions of the voids we recover — and the imprint of that leakage on the VSF is exactly what my thesis aims to model.
Year by year, the camera deepens its coverage of the southern sky: each new visit adds a layer of galaxies, and by Year 10 the field is dense enough to detect tens of thousands of cosmic voids. The Rubin/LSST cadence is, in reality, ~3 000 visits per night over the full decade — this animation is a stylised year-by-year sketch of the build-up.
Photometric redshifts — power and pitfalls
A galaxy's redshift tells us its distance. Spectroscopy measures it to ~0.001 by finding a sharp emission or absorption line, but it is slow and expensive. Photometric redshifts infer the same quantity from broadband colours — fast, scalable, and noisy.
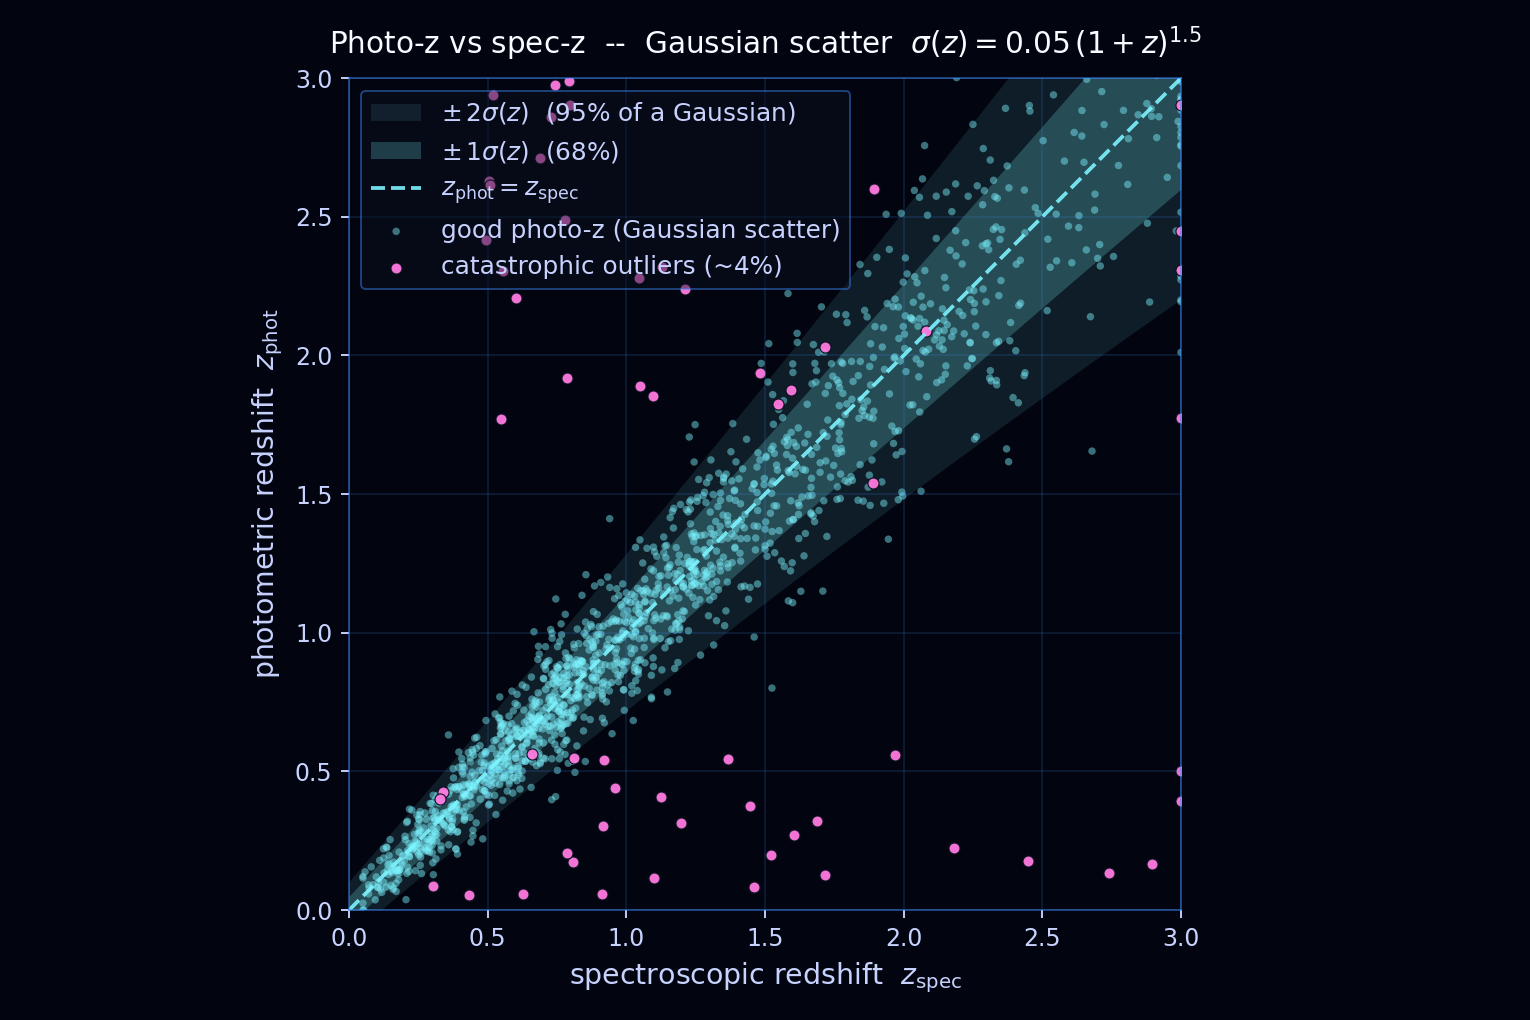
A photo-z algorithm — whether a template-fitting code like BPZ or a machine-learning regressor — guesses redshift from a handful of magnitudes by matching observed colours against spectral templates. For LSST, the precision target is σz/(1+z) ≲ 0.03 for the gold sample, with a small catastrophic-outlier rate.
Catastrophic outliers — galaxies whose photo-z is grossly wrong, often because the 4 000 Å break is misidentified — are particularly insidious: they look like real galaxies in the middle of a void, masking real voids.
The advantage of photometric surveys is sheer numbers: Rubin will deliver photo-z for hundreds of times more galaxies than DESI will ever measure spectroscopically. The challenge is to forward-model the photo-z error distribution into the void statistics, propagate it through the void-finder, and recover an unbiased VSF.
- ~99 % of LSST galaxies will have only photometric redshifts.
- Photo-z scatter σ ~ 0.03 (1+z) translates to a radial smearing of ~100 Mpc/h at z = 1.
- Need joint calibration of the n(z) using a small spec-z subset (DESI, 4MOST).
At the top of the animation each galaxy sits at its true 3D position and the cosmic-web filaments + voids are perfectly readable. As you scroll, every galaxy is displaced horizontally (along the line of sight) by a Gaussian draw whose width grows with the simulated photo-z scatter σ. By the end the filaments have blurred and the voids have visibly filled with shuffled galaxies — this is exactly the systematic that the next plot quantifies on the VSF.
Both panels show the SAME thin redshift slice (~69.5 Mpc/h thick, z ∈ [0.45, 0.48]) of the Abacus SkySim simulation (Mhalo > 1012.5 M⊙), projected onto a 20° × 20° RA-Dec patch and sub-sampled to 5 000 galaxies per panel for clarity. On the left, galaxies are selected on their true (spectroscopic) redshift. On the right, the slice is selected on the photometric redshift with a Gaussian scatter σz = 0.02 (1+z) — so the photo-z error pushes some galaxies out of the window and brings new ones in. As you scroll the right panel cross-fades from the true-z to the photo-z selection; the cluster / void pattern stays clearly recognisable, even though only ~38 % of the individual galaxies are the same. That's the motivation for using 2D void finders on photometric surveys, which I will illustrate in a future animation.
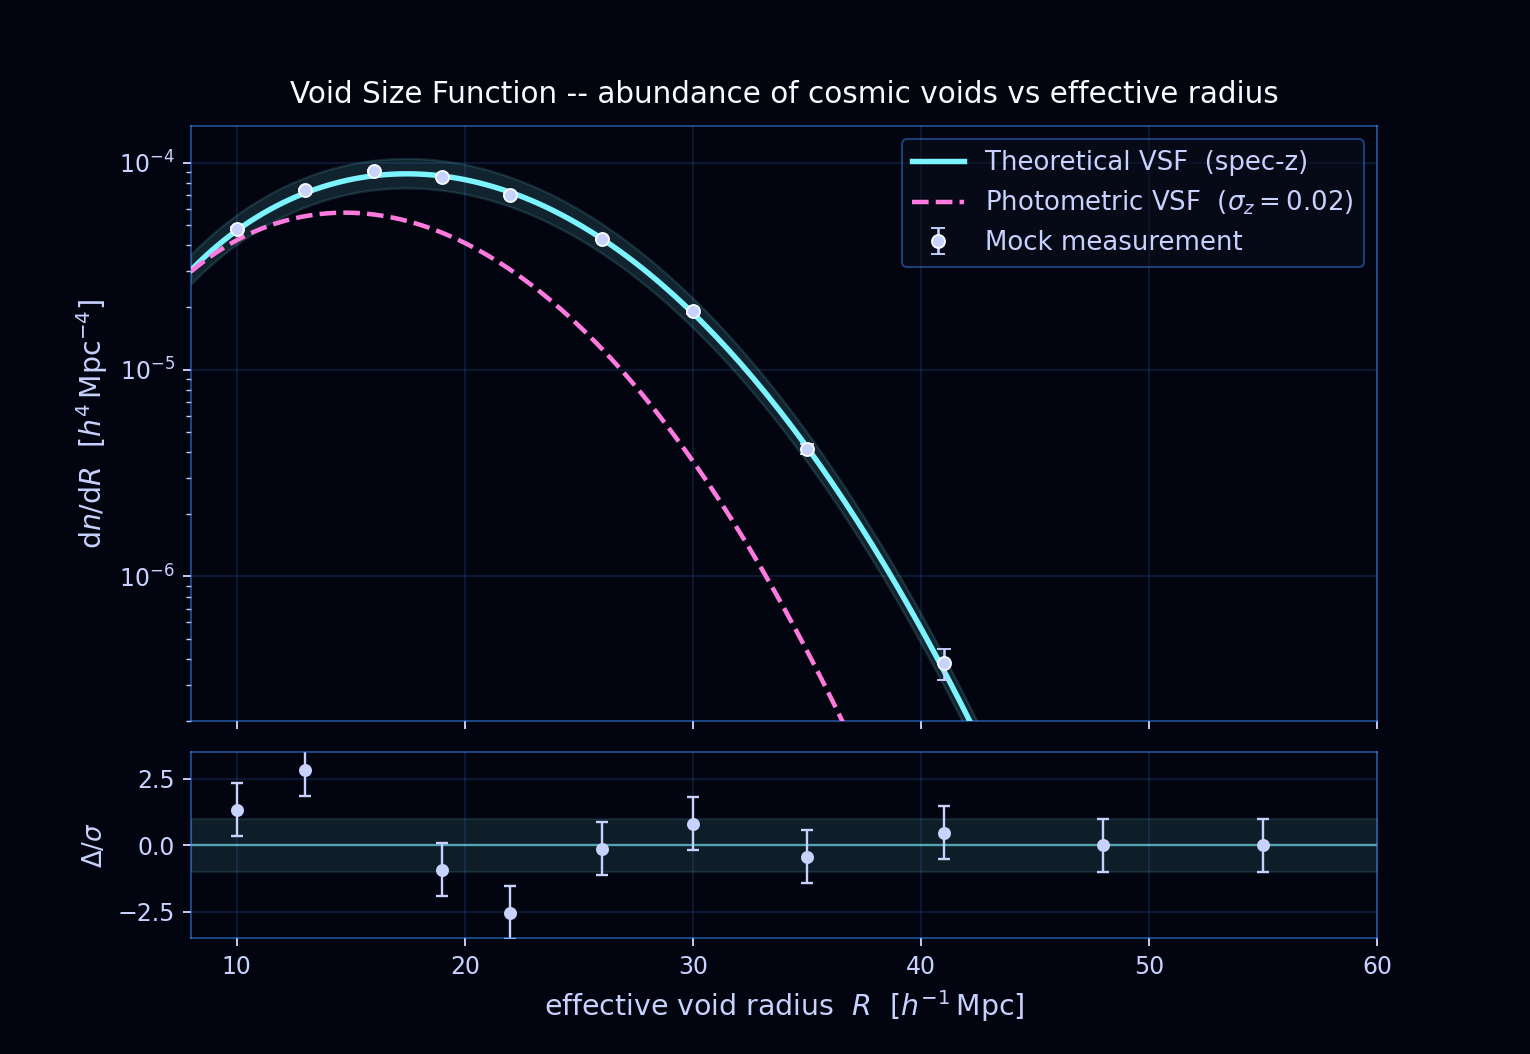
The photo-z imprint on the Void Size Function
The shuffling above is not just cosmetic: it directly biases the observed VSF. Photo-z scatter smooths over small voids, distorts the radial scale, and shifts the abundance toward smaller radii. The plot below makes that quantitative.
Sub-projects
My PhD splits into four intertwined sub-projects, each tackling one piece of the photo-z → void puzzle. Detailed write-ups live behind a passphrase until publication — drop me an email if you'd like access.
The universal multiplicity function: extension to photometric-redshift uncertainties
Extending the universal multiplicity function — the analytic backbone of the void abundance — to include the smearing introduced by photometric redshift errors.
B Private draftCosmology from the Rubin Void Size Function
Forecasting cosmological constraints from the VSF measured on LSST-like SkySim mocks across three redshift bins and three cosmologies.
C Private draftConverting 2D voids into 3D voids
Bridging voids detected on the projected sky to their three-dimensional counterparts — a key step for photometric surveys.
D Private draftVoidX-Voronoi: a graph-attention network for void classification
A deep graph-attention model that learns to classify cosmic voids directly from the Voronoi tessellation of a galaxy catalogue.
Want to discuss voids, photo-z or LSST?
I'm always happy to chat about cosmic structure, simulations, or anything that lives in the underdense parts of the Universe.